
Fetching Singapore flat resale data
Motivation
In this exercise, I will create a script to download information from www.data.gov.sg, the Singapore government’s one-stop portal to its publicly-available datasets. Specifically, this script will fetch information about the resale of HDB flats from one of data.gov.sg’s publicly available datasets – Resale Flat Prices. The original provider of this dataset is the Housing and Development Board (HDB). This is part of my bigger project to create a machine learning product that can forecast house prices in Singapore.
The dataset contains the following features:
- month - the month in which the sale of the flat took place
- town - the town (region) in which the flat is located
- flat_type - the flat’s type
- block - the block in which the flat is located
- street_name - the street on which the flat is located
- storey_range - the storey range in which the flat unit is located
- floor_area_sqm - the flat’s floor area in square meters
- flat_model - the model of the flat.
- lease_commence_date - the year in which the flat’s lease commenced
- remaining lease - the remainig lease of the flat in years
- resale price - the resale price of the flat in Singapore dollars
The dataset was last updated on 9 January 2019 and covers HDB resale transactions from 1 January 2015 to 31 December 2018.
Engineering considerations
In choosing this dataset and in designing this script, I took into account several concerns that I believe are critical to the success of the project. These concerns, as well as my thought process as to how my script addresses these concerns, are elaborated below.
-
Usefulness. I believe the data fetched using this script contains several features that are useful in building machine learning models that will help Real Real Estate Agency Pte Ltd achieve its objective – to provide interested homebuyers with realistic house price forecasts.
-
Trustworthiness. Accuracy and trustworthiness of the source data are of paramount importance in data analysis. I have chosen a dataset provided by HDB, as HDB is a Singapore government agency and one can be certain of the accuracy and trustworthiness of the housing data provided by HDB.
-
Up-to-dateness. The dataset is updated monthly; as such, users can be certain that the data obtained using this script is always up to date to the latest month.
-
Ease of retrieval. In addition, the platform on which the data is hosted, www.data.gov.sg, has made available a well-documented API using which this information can be conveniently fetched.
-
Flexibility I have designed this script in a way that provides flexibility to users. This script consists of a single Python function,
download_data, with which users can export the data in one of the three specified formats: json object, pandas dataframe or csv files. These are the three data formats that are among the commonly used formats in data science. In addition, I have also included some data cleaning steps prior to exporting to this information to pandas dataframe or csv files. These cleaning steps will faciliate downstream data analysis. -
Robustness I have included in my script several assertions, which will produce unambiguous error messages when an error occurs.
# Importing dependencies
import requests
import pandas as pd
import datetime
import json
# Main function

def download_data(selection = "json", month = "2018-12", limit = 100, offset = 0):
    """
    Arguments:
        - selection: string, default "json"
              Format of the data returned by the function. User to choose from "json", "pandas" and "csv".
        - month: string with format('YYYY-MM'), default "2018-12"
              The month in which the sale of the flat took place.
        - limit: int, default 100
              The number of rows to be fetched.
        - offset: int, default 0
              The number of rows to be skipped.

    Returns:
        - Data containing HDB resale prices on a specific month between 2015 and 2018 in user's specified format.
          The data are arranged from the most recent to the oldest
    """
    assert type(selection) is str, "'selection' has to be a string"
    assert selection in ["json", "pandas", "csv"], "wrong format chosen"
    assert type(month) is str, "'month' has to be a string with the format 'YYYY-MM'"
    assert len(month) is 7, "'month' has to be a string with the format 'YYYY-MM'"
    assert month[:4] in ["2015", "2016","2017","2018"], "Wrong year; this dataset only contains data from 2015 to 2018"
    assert int(month[-2:]) in list(range(1,13)), "Wrong month; the 'month' portion of your 'month' variable should be a two-digit number between 01 and 12"
    assert type(limit) is int, "'limit' has to be an integer"
    assert type(offset) is int, "'offset' has to be an integer"
    assert limit >= 0, "'limit' has to be equal to or greater than zero"
    assert offset >= 0, "'offset' has to be equal to or greater than zero"

    # Constructing URL that takes into account user's preferences (month, limit and offset)
    url = "https://data.gov.sg/api/action/datastore_search?resource_id=1b702208-44bf-4829-b620-4615ee19b57c&limit=" + \
          str(limit) + \
          "&offset=" + \
          str(offset) + \
          "&q=%7B%22month%22%3A%20%22" + \
          month + \
          "%22%7D&sort=%22_id%22%20desc"

    # Printing disclaimer about the source and the licensing information about the data
    now = datetime.datetime.today().strftime('%d %B %Y')
    disclaimer = "This code contains information from the dataset 'Resale Flat Prices' accessed on {} from www.data.gov.sg. This information is made available under the terms of the Singapore Open Data Licence version 1.0."
    print(disclaimer.format(now))

    # Creating a connection object
    connection = requests.get(url)
    print("-----------------------------------------------------------------------------")
    if connection.status_code == 200:
        print("Status code of {} was obtained; Connection was successfully established.".format(connection.status_code))
    else:
        print("Status code of {} was obtained; Connection was NOT successfully established.".format(connection.status_code))
    print("-----------------------------------------------------------------------------")

    # Downloading the information into a json object
    data_json = connection.json()
    data_json = data_json["result"]["records"]

    # Returning the information in a format specified by the user
    # If the selection is "json", the function directly returns the json object
    if selection == "json":
        return(data_json)

    # If the selection is "pandas", the function returns a pandas dataframe.
    # Several cleaning steps are included. Some of these steps convert the `month` and `lease_commencement_date` to pandas' datetime object for easier analysis.
    # There are also steps to drop the columns that are of little use for data analysis, full count and ID.
    elif selection == "pandas":
        data_json_str = json.dumps(data_json)
        df = pd.read_json(data_json_str)
        df["month"] = pd.to_datetime(df["month"], format = "%Y-%m")
        df["lease_commence_date"] = pd.to_datetime(df["lease_commence_date"], format = "%Y")
        df.drop(["_full_count", "_id"], axis = 1, inplace = True)
        return df

    # If the selection is "csv", the function returns a csv file, 'result.csv'. The aforementioned cleaning steps are included.
    elif selection == "csv":
        data_json_str = json.dumps(data_json)
        df = pd.read_json(data_json_str)
        df["month"] = pd.to_datetime(df["month"], format = "%Y-%m")
        df["lease_commence_date"] = pd.to_datetime(df["lease_commence_date"], format = "%Y")
        df.drop(["_full_count", "_id"], axis = 1, inplace = True)
        print("Data has been downloaded into the file 'result.csv'")
        return df.to_csv("result.csv")
Demonstration
Below, we will see how the script works in action. I will use the script to create a pandas dataframe containing 200 HDB flat resale transactions that took place in March 2016.
df = download_data(selection = "pandas", month = "2016-03", limit = 200, offset = 0)

print("\n ---dataframe preview---\n")
display(df.head(3))

print("\n ---dataframe shape---\n")
display(df.shape)

print("\n ---dataframe information---\n")
display(df.info())
This code contains information from the dataset 'Resale Flat Prices' accessed on 20 January 2019 from www.data.gov.sg. This information is made available under the terms of the Singapore Open Data Licence version 1.0.
-----------------------------------------------------------------------------
Status code of 200 was obtained; Connection was successfully established.
-----------------------------------------------------------------------------

 ---dataframe preview---
| block | flat_model | flat_type | floor_area_sqm | lease_commence_date | month | rank month | remaining_lease | resale_price | storey_range | street_name | town | |
|---|---|---|---|---|---|---|---|---|---|---|---|---|
| 0 | 605 | Multi Generation | MULTI-GENERATION | 163 | 1988-01-01 | 2016-03-01 | 0.090167 | 70 | 688000 | 01 TO 03 | YISHUN ST 61 | YISHUN |
| 1 | 724 | Apartment | EXECUTIVE | 145 | 1986-01-01 | 2016-03-01 | 0.090167 | 69 | 650000 | 10 TO 12 | YISHUN ST 71 | YISHUN |
| 2 | 877 | Maisonette | EXECUTIVE | 145 | 1987-01-01 | 2016-03-01 | 0.090167 | 70 | 648000 | 04 TO 06 | YISHUN ST 81 | YISHUN |
 ---dataframe shape---


(200, 12)


 ---dataframe information---

<class 'pandas.core.frame.DataFrame'>
Int64Index: 200 entries, 0 to 199
Data columns (total 12 columns):
block                  200 non-null object
flat_model             200 non-null object
flat_type              200 non-null object
floor_area_sqm         200 non-null int64
lease_commence_date    200 non-null datetime64[ns]
month                  200 non-null datetime64[ns]
rank month             200 non-null float64
remaining_lease        200 non-null int64
resale_price           200 non-null int64
storey_range           200 non-null object
street_name            200 non-null object
town                   200 non-null object
dtypes: datetime64[ns](2), float64(1), int64(3), object(6)
memory usage: 20.3+ KB


None
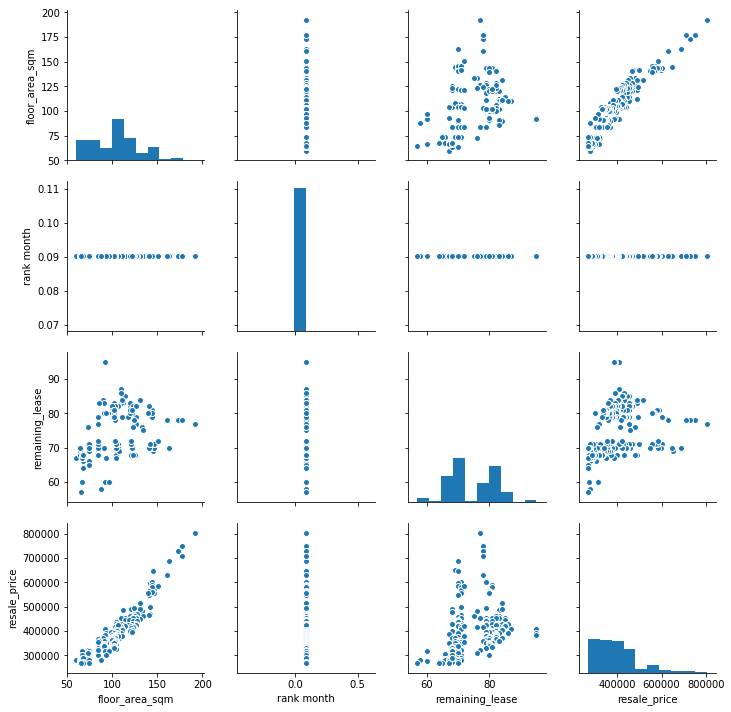
This script can be conveniently used in a broader data science project. Below, I have provided an example of a downstream exploratory step that can be undertaken after fetching this data. In this step, I create a pairplot that showcases relationships among the various features of the data.
import matplotlib.pyplot as plt
import seaborn as sns
%matplotlib inline

sns.pairplot(df)
<seaborn.axisgrid.PairGrid at 0x107ffa550>
Leave a comment